|
||||||||||||||||||
| |||||||||||||||||||
|
Women
in the Arab World:
Situation
and Perspectives
(A
Statistical Approach - excerpts)
Akram
Antaki
To
my wife Mouna, My
daughters Lana and Noura And
my son Tarek… Table of Contents 2 – (U.N.) World’s Women 2000: Trends and
Statistics. 2 – 2: Women and Men in
Families. 2 – 4: Education and Communication. 2 – 6: Human
Rights and Political decision-making. 3
– The Situation within the Arab countries (A briefing) 3 – 3: Libya 3 – 6: Somalia 3 – 12: Kuwait 3
– 13: Lebanon 3 – 14: Occupied Palestinian Territories 4 – Factors of Influence - I (A Comparative First Approach). 4 – 1 – 2:
The Economical Situation. 4 – 1 – 3: Economical Regimes and Political Conjunctures. 4 – 2 – 1: Ethnic and Religious composition. 4 – 2 – 3: Higher Education. 4 – 2 – 4: Openness to
the External Word. 5 – Factors
of Influence - II (Going beyond the Numbers). 5 – 1:
Countries Background and level of Civilization. 5 – 2:
Religion, State and Fundamentalism.
5
– 3: Political Factor (Democracy and Dictatorship). 6 – 1: Arab
Women’s Situation. 6 – 2: Arab Women and
Families. 6 – 3: Arab Women and
Health. 6 – 4: Arab Women,
Education and Communication. 6 –
6: Arab Women, Human Rights and Political decision-making. 7 –
Conclusions and Recommendations. Appendix 1: A – 2: United States Introduction
I still remember that evening. We were
watching TV. It was a concert by Um Kulthum in the Cairo Opera House in the
early sixties, when, all of a sudden, with her low voice, Mouna made this short
comment: -
Look
Akram! There is not one single veiled woman in the whole audience! And
really, there was not one single woman veiled in all the audience! And the
concert was almost 40 years ago! Now, suffice us to have a short glimpse of
people walking in the streets of Damascus and/or Cairo to realize how deeply we
have changed. Now, the percentage of veiled women within our societies seems on
its way to become prevailing again. And this reality, sad for some of us,
rejoicing for others, has many complex reasons. And,
these reasons are obsessing; they have been stimulating me for a long time to
write something about the issue. But, for a reason or another, I did always
postpone it. Until some months ago, when I read in the eighth issue of Maaber an article by George Farah
entitled “Malehood in our traditions,” I made up my mind to write something,
“an essay,” about “Women’s Situation in the Arab World”; and this, as
a first approach, leads me to the… (U.N.)
World’s Women 2000: Trends and Statistics. Because
numbers are the first thing we need to evaluate our situation, I begin with the (U.N.)
world’s women 2000 Trends and Statistics that gives the following main
findings about the women situation in the world for the following topics: Where
the most important findings are that: A
– Women are
having fewer children on average but with more women
of
reproductive age, world population continues to grow. B
– Population of 1.15 billion adolescents, living mostly in developing
countries, is largest in history. C
– Population of people over 60 is expected to grow from 600 million to 1
billion in next 20 years, with many older women than men. D
– Populations around the world are ageing as fewer children are born and
people live increasingly longer lives. E
– Although women
outnumber men in most regions, men outnumber women in parts of Asia. F
– Women represent a large proportion of international migrants—an
estimated 56 million women out of a total of 118 million migrants. 2
– 2: Women and Men in Families. Where
the most important findings are that: A
–
Women are generally marrying later but more than a quarter of women aged 15 to19
are married in 22 countries—all in developing regions. B – Informal unions are
common in developed regions and in some countries of the developing regions. C – Birth
rates continue to decline in all regions of the world. D
– Births to unmarried women have increased dramatically in developed
regions. E
– More people are living alone in the developed regions, and the majority
are women. F
–
In many countries of the developed regions, more than half of mothers with
children under age three are employed.
Where
the most important findings are that: A – Life expectancy continues
to increase for women and men in most developing regions but has decreased
dramatically in Southern Africa as a result of AIDS. B – Infant mortality is
generally higher for boys than for girls, except for some countries in Asia
where gender-based discrimination outweighs girls’ biological advantage. C – Where women are sexually
active at a young age, they are at risk of suffering short- and long-term
consequences of sexually transmitted infections (including HIV), early pregnancy
and unsafe abortion. D – Data on maternal
mortality and other causes of death are often unavailable or, where available,
are unreliable due to deficiencies in vital statistics registration systems. E – Data on maternal
mortality and other causes of death are often unavailable or, where available,
are unreliable due to deficiencies in vital statistics registration systems. F – New efforts are being
made to measure health expectancy—not just life expectancy—of the world’s
ageing population. 2
– 4: Education and Communication. Where the most important findings are that: A – The gender gap in primary
and secondary schooling is closing, but women still lag behind men in some
countries of Africa and Southern Asia. B – Two thirds of the
world’s 876 million illiterates are women, and the number of illiterates is
not expected to decrease significantly in the next twenty years. C – Women have made
significant gains in higher education enrolment in most regions of the world; in
some regions, women’s enrolment now equals or surpasses that of men. D – More women than men lack
the basic literacy and computer skills needed to enter “new media”
professions. E – In many countries, women
represent a rapidly increasing share of Internet users. Where the most important findings are that: A – Women now comprise an
increasing share of the world’s labor force—at least one-third in all
regions except northern Africa and western Asia. B – Self-employment and
part-time and home-based work have expanded opportunities for women’s
participation in the labor force but are characterized by lack of security, lack
of benefits, and low income. C – The informal sector is a
larger source of employment for women than for men. D – More women than before
are in the labor force throughout their reproductive years, though obstacles to
combining family responsibilities with employment persist. E – Women, especially younger
women, experience more unemployment than men and for a longer period of time
than men. F – Women remain at the lower
end of a segregated labor market and continue to be concentrated in a few
occupations, to hold positions of little or no authority and to receive less pay
than men. G – Available statistics are
still far from providing a strong basis for assessing both quantitative and
qualitative changes in women’s employment. 2
– 6: Human Rights and Political decision-making. Where the most important findings are that: A – All but 26 States have
ratified the Convention on the Elimination of All Forms of Discrimination
against Women, making it the second most widely ratified human rights treaty. B – Physical and sexual abuse
affect millions of girls and women worldwide—yet are known to be seriously
under-reported. C – In some African
countries, more than half of all women and girls have undergone female genital
mutilation and its prevalence is not declining. D – Women and girls comprise
half of the world’s refugees and, as refugees, are particularly vulnerable to
sexual violence while in flight, in refugee camps and/or during resettlement. E – Despite calls for gender
equality, women are significantly under-represented in Governments, political
parties and at the United Nations. And,
by focusing on the Arab World, we notice that these general findings and their
related statistics gives us spotlights on women’s situation in the Arab
countries that does not seem to be very brilliant. And we ask ourselves about
the real causes of such a situation? Why is it relatively acceptable in here
and/or relatively bad or worse in there? Is it evaluated positively or
negatively in each country and in general? To answer all these questions we went
deeper into the… The
Situation within the Arab countries Because,
It is clear from U.N. statistics, like for all those who visit the Arab
countries, that there are big differences between them, in general, and so far
as women are concerned, in particular. In Lebanon and, more or less, in Syria,
Jordan, Egypt, Morocco and Tunisia women’s situation according to standards of
the civilized world looks better than in others Arab countries like Saudi
Arabia, United Arab Emirates, or Sudan. And the reasons for that are many and
differ from a country to another. A
general lookout on the situation within these countries, based on the following
main sources that are the CIA World Fact Book, the World Bank reports
and Statistics, the UNESCO Institute of Statistics, the Encyclopedia
Britannica and the Encyclopédie Larousse gives us the following
results: To these countries, we add Israel
where 20% of the population is Arab. And, for comparative purposes we make a
look out on the situation within some of the most developed and influential
“Western countries” mean the United States, the United
Kingdom, Germany and France; and also for
the same purposes, a look out on some very specific non-Arab Muslim countries
mean Turkey, Iran and Pakistan. 3
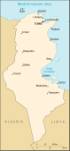
– 8: Tunisia
| |||||||||||||||||||||||||||||||||||||||||||||||||||||||||||||||||||||||||||||||||||||||||||||||||||||||||||||||||||||||||||||||||||||||||||||||||||||||||||||||||||||||||||||||||||||||||||||||||||||||||||||||||||||||||||||||||||||||||||||||||||||||||||||||||||||||||||||||||||||||||||||||||||||||||||||||||||||||||||||
|
Life expectancy at birth
(years) |
1980 |
1990 |
1995 |
2000 |
|
Male |
61 |
69 |
70 |
70 |
|
Female |
63 |
72 |
73 |
74 |
HIV/AIDS – adult
prevalence rate: 0.04% (1999 est.).
Major causes of death per 100,000 population: n.a.;
however, of approximately 12,000 deaths for which a cause was reported in 1992,
complications of pregnancy and childbirth represented 31.6%, circulatory
diseases 22.4%, accidents and poisoning 14.9%, respiratory diseases 7.2%.
Note: Health conditions in Tunisia are improving, though far from adequate,
and compare favorably to those of many developing countries.
Copyright
© 1994-2002 Encyclopædia Britannica, Inc.
Literacy:
|
TUNISIA |
Year |
Illiteracy rate (%) |
Illiteracy population (000) |
Total adult population (000) |
||||||
|
|
|
Total |
Male |
Female |
Total |
Male |
Female |
Total |
Male |
Female |
|
|
1970 |
72.6 |
59.1 |
85.2 |
2,000 |
787 |
1,214 |
2,756 |
1,332 |
1,424 |
|
|
1975 |
63.7 |
50.5 |
77.1 |
2,029 |
809 |
1,220 |
3,185 |
1,602 |
1,582 |
|
|
1980 |
55.1 |
41.6 |
68.8 |
2,074 |
788 |
1,286 |
3,763 |
1,894 |
1,869 |
|
|
1985 |
47.4 |
34.0 |
61.0 |
2,100 |
757 |
1,343 |
4,429 |
2,227 |
2,202 |
|
|
1990 |
40.9 |
28.4 |
53.5 |
2,081 |
726 |
1,355 |
5,088 |
2,554 |
2,534 |
|
|
1995 |
35.3 |
24.0 |
46.7 |
2,085 |
711 |
1,374 |
5,903 |
2,961 |
2,942 |
|
|
2000 |
29.0 |
18.6 |
39.4 |
1,928 |
621 |
1,307 |
6,650 |
3,334 |
3,316 |
|
|
2005 |
23.8 |
14.4 |
33.3 |
1,754 |
530 |
1,224 |
7,369 |
3,693 |
3,677 |
|
|
2010 |
19.6 |
11.0 |
28.3 |
1,567 |
442 |
1,126 |
7,987 |
4,004 |
3,983 |
|
|
2015 |
16.1 |
8.4 |
23.9 |
1,363 |
357 |
1,007 |
8,467 |
4,247 |
4,220 |
UNESCO Institute of Statistics (for populations
aged 15 and above)
Education
access and attainment:
|
|
1980 |
1990 |
1995 |
2000 |
|
Net primary enrollment
rate (% of age group) |
|
|
|
|
|
Male |
92 |
97 |
100 |
99 |
|
Female |
72 |
90 |
95 |
96 |
|
Progression to grade 5 (%
of cohort) |
|
|
|
|
|
Male |
89 |
92 |
90 |
.. |
|
Female |
84 |
78 |
92 |
.. |
|
Primary
completion rates |
|
|
|
|
|
Male |
.. |
.. |
.. |
.. |
|
Female |
.. |
.. |
.. |
.. |
|
Youth illiteracy Rate (%
of people aged 15-24) |
|
|
|
|
|
Male |
14.4 |
7.2 |
4.4 |
2.6 |
|
Female |
41.9 |
24.8 |
16.3 |
10.8 |
Television
and Internet:
|
|
1995 |
2000 |
|
Television Set per 1000
people |
89 |
198 |
|
Internet User (1000) |
1 |
100 |
Population
(2001): 9,705,102 (July 2001 est.).
|
Population |
1980 |
1990 |
1995 |
2000 |
|
Total (millions) |
6.4 |
8.2 |
9.0 |
9.6 |
|
Female population (% of
total) |
49.3 |
49.4 |
49.5 |
49.5 |
Density (2001): persons per sq km 59.3.
Urban-rural (1994): urban 61.0%; rural 39.0%.
Sex distribution (2001):
-
at birth: 1.08 male(s)/female
-
under 15 years: 1.07 male(s)/female
-
15-64 years: 1 male(s)/female
-
65 years and over: 0.99 male(s)/female
-
total population: 1.02 male(s)/female (2001 est.)
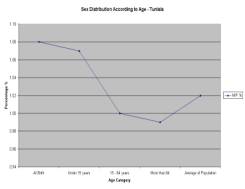
1 – Sex Distribution
Age Structure (2001):
-
0-14 years: 28.74% (male 1,440,636; female 1,348,133)
-
15-64 years: 65.12% (male 3,157,988; female 3,161,596)
-
65 years and over: 6.14% (male 296,930; female 299,819) (2001 est.)
Population projection: (2010) 10,661,000; (2020) 11,641,000.
Note: Nearly two-fifths of Tunisia’s population is under 15 years of age.
The annual rate of population growth is high by world standards but is
comparatively low for the Middle East and North Africa. Governmental efforts to
promote family planning and a high rate of emigration have in part suppressed
the rate of population growth. The country’s population density is the highest
in North Africa, with most people living near the coast and more than half
living in urban areas. The entire southern half of Tunisia is only lightly
populated.
Copyright
© 1994-2002 Encyclopædia Britannica, Inc.
Doubling time: 54 years.
Ethnic composition: Arab 98%, European 1%, Jewish and other 1%
Note: Tunisia’s population is largely a mixture of Arab and Berber elements.
Arabs came to North Africa beginning in the 7th century and eventually conquered
the indigenous Berbers. The Arabs brought their language and religion with them
and intermarried with the local people. Most Tunisians today claim Arab ancestry
and culture, and only traces of Berber culture remain.
Copyright
© 1994-2002 Encyclopædia Britannica, Inc.
Religious affiliation: Muslim 98%, Christian 1%, Jewish and other 1%
Major cities (commune; 1994): Tunis 674,100; Safaqis
230,900; Aryanah 152,700; Ettadhamen 149,200; Susah 125,000.
A – General Overview:
Tunisia has a diverse economy, with important
agricultural, mining, energy, tourism, and manufacturing sectors. Governmental
control of economic affairs while still heavy has gradually lessened over the
past decade with increasing privatization, simplification of the tax structure,
and a prudent approach to debt. Real growth averaged 5.5% in the past four
years, and inflation is slowing. Growths in tourism and increased trade have
been key elements in this steady growth. Tunisia’s association agreement with
the European Union entered into force on 1 March 1998, the first such accord
between the EU and Mediterranean countries to be activated. Under the agreement
Tunisia will gradually remove barriers to trade with the EU over the next
decade. Broader privatization, further liberalization of the investment code to
increase foreign investment, and improvements in government efficiency are among
the challenges for the future.
B – Economical Statistics:
GDP: purchasing power parity – $62.8 billion (2000 est.)
GDP – real growth rate: 5%
(2000 est.)
-
1996: 7.1%;
-
1999: 6.1;
-
2000: 4.7 as per World Bank
data profile.
|
|
1982-86 |
1987-91 |
1992-96 |
1997-200 |
|
Real
GDP growth |
2.8 |
4.1 |
3.9 |
5.3 |
Source: Tunisia LDB; Average for 1984-86.
GDP – per capita: purchasing power parity
– $6,500 (2000 est.)
GDP – composition by sector:
-
agriculture: 14%
-
industry: 32%
-
services: 54% (1999)
Population below poverty line: 6%
(2000 est.)
Inflation rate (consumer prices): 3%
(2000 est.)
|
|
1982-86 |
1987-91 |
1992-96 |
1997-200 |
|
Inflation |
7.5* |
7.6 |
4.9 |
3.1 |
Source: Tunisia LDB; Average for 1984-86.
GNP per Capita:
|
|
1980 |
1990 |
1995 |
2000 |
|
GNP per capita(US$) |
1,360 |
1,430 |
1,820 |
2,100 |
2 -
GNP per Capita Progress
Labor force: 2.65 million (2000 est.)
Note: shortage
of skilled labor
|
LABOR FORCE PARTICIPATION |
1980 |
1990 |
1995 |
2000 |
|
Total labor force (millions) |
2 |
3 |
3 |
4 |
|
Female labor force (% of total) |
29 |
29 |
30 |
32 |
Labor
force – by occupation: services 55%, industry 23%,
agriculture 22% (1995 est.)
Unemployment rate: 15.6% (2000 est.)
|
Unemployment |
1980 |
1990 |
1995 |
2000 |
|
Total (% of total labor
force) |
.. |
.. |
.. |
.. |
|
Female (% of female labor
force) |
.. |
.. |
.. |
.. |
Debt – external: $13.0 billion (2000 est.)
|
|
الصفحة الأولىFront Page |
افتتاحيةEditorial |
منقولات روحيّةSpiritual Traditions |
أسطورةMythology |
قيم خالدةPerennial Ethics |
ٍإضاءاتSpotlights |
إبستمولوجياEpistemology |
طبابة بديلةAlternative Medicine |
إيكولوجيا عميقةDeep Ecology |
علم نفس الأعماقDepth Psychology |
اللاعنف والمقاومةNonviolence & Resistance |
أدبLiterature |
كتب وقراءاتBooks & Readings |
فنّArt |
مرصدOn the Lookout |
|
|
|
|